
A skin can become more expensive in its source currency while looking cheaper after conversion to yours. A converted chart combines two changes: the item's price and the exchange rate. Separating them can explain an apparent contradiction without assuming either chart is wrong.
This is a measurement exercise, not a forecast. It can help you interpret saved prices, but it does not establish what a payment provider will convert or what a completed sale will put in your account.
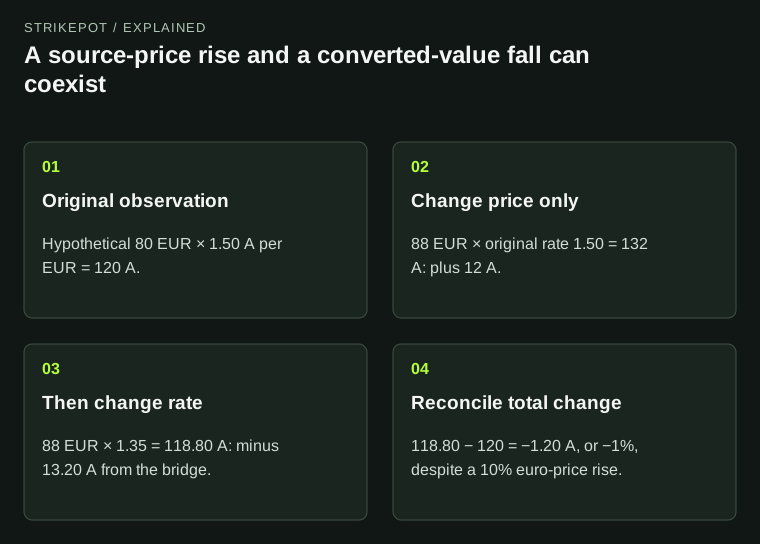
The order of the bridge is explicit. All prices and exchange rates are constructed for explanation.
Keep the original price before converting it
Start with the amount as supplied, its currency, price type and date. Then record the conversion rate and its direction. A rate of 1.50 currency-A units per euro means multiplying a euro amount by 1.50. Its inverse answers the opposite conversion and cannot be substituted without changing the operation.
Skinport's history documentation allows a requested pricing currency. When comparing saved responses, retain that parameter rather than treating the currency symbol as decoration. The same bare number in two currencies is not one unchanged value.
For Steam's account display rules, use the buyer-and-seller currency guide. The analysis here asks a different question: what contributed to a two-date change after you translated an amount into a common reporting currency?
A 10% rise can appear as a 1% fall
Every amount and rate in this example is invented. At Date A, an otherwise comparable price is 80 EUR. Assume a rate of 1.50 A per EUR, giving 120 A. At Date B, the source price is 88 EUR and the assumed rate is 1.35 A per EUR, giving 118.80 A.
| Hypothetical input | Date A | Date B |
|---|---|---|
| Source-currency price | 80 EUR | 88 EUR |
| Conversion rate | 1.50 A per EUR | 1.35 A per EUR |
| Converted value | 120 A | 118.80 A |
The price in euros rises by 10%. The conversion factor falls by 10%. The converted value falls by 1%, because 1.10 × 0.90 equals 0.99. Adding the two percentage changes and declaring no movement would miss that multiplicative relationship.
This example holds item identity and price basis constant. If one record is a buyer total and the other seller proceeds, currency is only one of several differences. Resolve those differences before attributing the whole gap to exchange rates.
A converted historical series may have its own methodology. Before reconstructing it, establish whether it applies a separate historical rate to each observation or translates a series using another stated convention. The currency parameter alone does not answer that question. If the provider does not document the treatment, use your own explicitly labeled conversion exercise rather than claiming to have recovered its internal calculation.
Separate the contributions in currency units
You can reproduce the result with two counterfactual steps. First change only the skin price, keeping the original rate: 88 × 1.50 equals 132 A. Compared with the original 120 A, that is a 12 A price effect.
Then apply the later rate to that later skin price: 88 × 1.35 equals 118.80 A. The second step removes 13.20 A. Together the steps explain the total change of minus 1.20 A.
The order matters for the attribution, although it does not change the final value. If you change the exchange rate first, you attribute minus 12 A to that step and plus 10.80 A to the subsequent skin-price step. Both bridges reconcile. Label the order instead of presenting either allocation as uniquely determined.
A three-part bridge makes the interaction visible
Another method uses the original values for both isolated effects and reports the interaction separately. In this example the isolated price effect is (88 − 80) × 1.50, or plus 12 A. The isolated rate effect is 80 × (1.35 − 1.50), or minus 12 A.
The remaining interaction is (88 − 80) × (1.35 − 1.50), or minus 1.20 A. Adding all three gives the observed minus 1.20 A. You do not need this decomposition for every price check, but it explains why the two equal percentage changes did not cancel.
Keep the calculations in a consistent reporting currency. A “12-unit effect” without a currency is ambiguous here, because the underlying source price and the resulting display use different units.
A reference rate is not your transaction rate
The European Central Bank's reference-rate page identifies its rates as informational and discourages transactional use. That illustrates a broader distinction: a rate used to explain a historical chart is not automatically a rate available in your checkout or payout.
For a real completed transaction, preserve the actual debited and credited amounts, quoted conversion and any separately disclosed deductions. Replacing the applied rate with a later public reference can prevent your records from reconciling even when both sources are accurate for their own purposes.
The sale-quote guide helps keep the gross/net basis straight. Do not subtract a conversion cost again if the receiving amount already incorporates it. The analytical bridge explains movement; the transaction record establishes what happened to your money.
Report both changes when both matter
A useful chart note states that the source-currency reference rose while the converted reference fell under the chosen rates. Add the dates, rate source and amount basis. That preserves the explanation instead of choosing whichever percentage supports a preferred story.
If the original-currency amounts or conversion method are missing, say that the contributions cannot be separated reliably. The practical next step is to recover those inputs, not to infer them from an unlabeled line. A common reporting currency makes comparisons possible only when the conversion remains part of the evidence.