
A market average can rise even when the price of every variant in the comparison falls. That happens when more expensive variants make up a larger share of the sales. The average answers what the changing group cost, while a player may be asking what happened to the same kind of item.
You do not need a broken chart or incorrect arithmetic to produce this result. You need a pooled dataset whose composition changes. Before interpreting a broad price line, check what was grouped together and how the mix changed between periods.
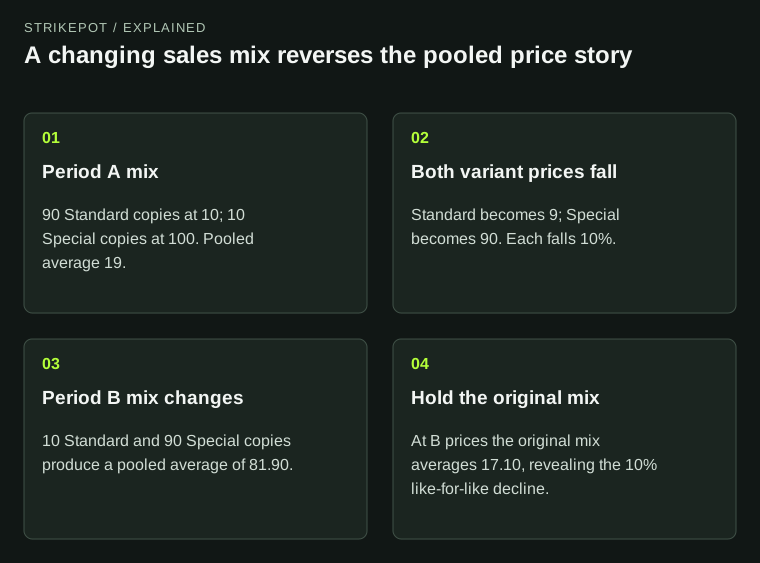
Hypothetical amounts separate within-variant price changes from changes in which variants sell.
A complete example with no rising prices
The following dataset is entirely hypothetical. It uses two imaginary variants, Standard and Special, in one currency. Within each period, every sale of a given variant takes place at the same assumed amount. That simplification lets you isolate the effect of composition without introducing another price distribution.
| Variant | Period A price | A copies sold | Period B price | B copies sold |
|---|---|---|---|---|
| Standard | 10 | 90 | 9 | 10 |
| Special | 100 | 10 | 90 | 90 |
| Total copies | — | 100 | — | 100 |
The Standard price falls by 10%, from 10 to 9. The Special price also falls by 10%, from 100 to 90. Yet the pooled average rises from 19 to 81.90. In Period A the calculation is (90 × 10 + 10 × 100) ÷ 100. In Period B it is (10 × 9 + 90 × 90) ÷ 100.
Most purchases in the first period concern the inexpensive variant. Most in the second concern the expensive one. An accurate description is that the average value of a sold copy increased as the mix changed. “Both variants became more expensive” would be false in this example.
Hold the mix still to ask a different question
Suppose your question concerns price movement for a consistent group. Apply Period A's quantities to both periods. The original mix of 90 Standard and 10 Special copies costs 1,900 at A prices and 1,710 at B prices. Dividing each by 100 gives comparable averages of 19 and 17.10: a 10% decline.
This is a counterfactual calculation. It asks what the original mix would have cost at the later prices. It does not claim that those later sales actually occurred in that mix. Keep the constructed measure separate from the observed pooled result.
Neither answer should silently replace the other. A shop researching its transaction values may care about the observed average of 81.90. A player comparing a particular Standard copy needs the Standard price evidence. A researcher describing like-for-like price movement may prefer the fixed composition, with its weights stated.
A fixed-mix calculation also needs a suitable price for each component in both periods. If one variant has no later observation, do not quietly treat its price as zero or reuse an old amount as fresh evidence. Report the unmatched component. You may calculate a matched subset, but identify its smaller scope and retain a consistent weighting rule. Otherwise the attempted correction introduces a second hidden change in composition.
The grouping key is part of the result
Skinport's Items documentation requires name and version together for variant identities. That is a concrete reason to preserve more than a short display name in a saved dataset. It does not establish that any particular market chart combines the imaginary groups in this article.
Before pooling, inspect the actual grouping rule. Does a row represent a full finish and exterior, one version, a broad weapon family or a mixed basket? What relevant information has already been discarded? If you cannot recover a variant distinction, acknowledge that limitation before describing its price movement.
A shared name does not make the observations interchangeable. Use the exact-listing guide when deciding which item properties matter. The statistical exercise begins after you have defined the categories, not before.
Count the right thing in the weights
A mix can be based on copies, order lines or total transaction value. These are different weights. CS Deals' average-sale documentation explicitly distinguishes sales from volume and weights prices by amount. Read the supplier's definition before adopting its field as your denominator.
In the example, 100 copies are sold in each period. Equal total counts do not produce equal composition: the shares move from 90% Standard to 10% Standard. Reporting only total volume would miss the mechanism causing the pooled line to rise.
Value weights answer another question again. The expensive group contributes disproportionately to currency turnover even when it accounts for relatively few copies. Do not call a currency-weighted measure the price paid for the typical copy unless you have explained what that means.
Recognize a possible mix effect without inventing one
A sudden change in a broad average is a reason to inspect its ingredients. It is not proof of composition bias. Real data may involve simultaneous changes in variant prices, quantities, source coverage and the age of observations. More than one explanation can operate at once.
If component data exists, calculate each group's price and share in both periods. Then compare the actual pooled result with a fixed-mix version. If only the pooled summaries are available, you cannot recover the missing shares by guessing. State that a like-for-like decomposition was unavailable.
Keep the original source, selection rules and arithmetic with your findings. The guide to sales measures explains the underlying summary labels; this additional composition check helps you decide which question the aggregate can answer. A striking line is easier to interpret once you know whether its subjects stayed the same.