
Adding daily average prices and dividing by the number of days gives every day equal influence. It does not necessarily give the average paid across all the copies sold. A quiet day with two sales would count as much as a busy day with 200.
To combine compatible averages, carry their underlying counts or quantities with them. First decide what your result should describe: an average day, an average order line or an average copy. Those questions can produce different answers from the same records.
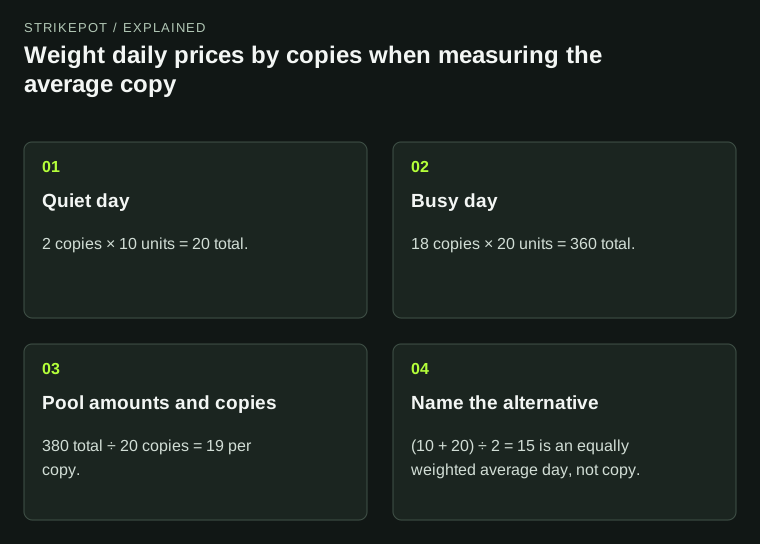
A hypothetical two-day dataset shows why the denominator determines what the average describes.
Two days, two very different weights
Take an entirely hypothetical item priced in one currency. On Day A, two copies sell for 10 each. On Day B, 18 copies sell for 20 each. The daily averages are 10 and 20, so their simple average is 15.
Across both days, however, the total paid is 2 × 10 + 18 × 20, or 380. Twenty copies changed hands. The average per copy is therefore 19. The simple average of 15 describes the two equally weighted daily averages; it does not describe the equally weighted copies.
| Period | Average per copy | Copies | Total value |
|---|---|---|---|
| Day A | 10 | 2 | 20 |
| Day B | 20 | 18 | 360 |
| Combined | 19 | 20 | 380 |
The reproducible formula is to multiply each compatible average by its weight, add those products, and divide by the sum of the weights. Equal daily weighting is valid when that is deliberately your question. The mistake is presenting it as a per-copy result.
An order line is not always one copy
Suppose another hypothetical dataset contains two order lines. The first records eight copies at 10 each; the second records two copies at 20 each. Averaging the two unit-price fields gives 15. The quantity-weighted result is (8 × 10 + 2 × 20) ÷ 10, or 12.
That dataset contains two lines and ten copies. Neither denominator is inherently wrong, but each must match the intended measure. A count of ten does not establish ten independent buyers, and a count of two does not describe only two units transferred.
CS Deals documents its average as price weighted by amount, with separate sales and volume fields. This is a useful concrete definition to check against your own calculation. Do not assume a similarly named field from another provider has the same denominator.
The component groups must fit together
Before pooling, require the same item definition, currency, amount basis and compatible inclusion rules. A full finish name may still need a variant field. Historical sales and active asking prices also cannot become one transaction average simply because they share a currency.
Use disjoint periods. If a seven-day statistic sits inside a 30-day statistic, combining them counts the recent week twice. The existing statistics guide explains those nested windows. Weighting corrects unequal counts; it does not correct duplicated observations.
Also inspect exclusions. A raw sales history and a cleaned aggregate may treat failed or refunded records differently. CS Deals' documentation explicitly describes an exclusion difference between those interfaces. A small mismatch in a reconstruction can reflect that population difference, rather than a faulty weighted-average formula.
Medians cannot be combined the same way
A median preserves ordering information at the middle of a sample. Once the individual values have been replaced by one median, much of the distribution is gone. Knowing each group's median and count is generally insufficient to recover the median of the combined observations.
Here are two invented pairs of three-observation groups. In Pair One, Group A is 1, 5, 100 and Group B is 6, 7, 8. Their medians are 5 and 7. Pool the six observations and the median is (6 + 7) ÷ 2, or 6.50.
In Pair Two, Group A is 5, 5, 5 and Group B is 1, 7, 7. The group medians are still 5 and 7, and both group counts are still three. Yet the pooled observations are 1, 5, 5, 5, 7, 7, whose median is 5.
Identical component counts and medians have produced different pooled medians. Averaging the group medians gives 6 in both cases, which recovers neither result. This is why multiplying medians by volume is not a substitute for pooling row-level sales.
Displayed precision limits reconstruction
If the source rounds every component average before publication, multiplying those displayed averages by counts may not recover its exact total. The hidden extra decimal places have already been discarded. Label your combined result as an approximation when that matters.
For example, a displayed average of 1.23 might summarize underlying transactions whose unrounded average lies just above or below that amount. Applying a large quantity magnifies the possible rounding difference. Adding more displayed decimal places afterward cannot restore the original information.
Skinport's history schema supplies named summary measures. Treat each field as its documented summary; do not infer an exact transaction list from it. If your analysis requires exact pooled values, obtain the underlying compatible records or keep the reconstruction limit visible.
Name the result so someone else can reproduce it
A useful final label says “quantity-weighted mean of the recorded completed sales in these two disjoint periods,” followed by currency, counts and the matching rule. That is much more informative than “monthly price,” especially when some days contain no observations.
Keep the arithmetic separate from a current sale estimate. The comparable-sales guide helps decide which records belong in the calculation. Once the population is defined, choosing the right weight lets the result answer a precise question instead of quietly changing the question as the sample gets busier.