
“Most listings sold” is meaningless without knowing which listings were tracked, for how long and what happened to the ones that disappeared. A watchlist full of completed successes can conceal unsold items that were removed, forgotten or never followed to an outcome.
To study a group, keep the original group intact. Record every listing's observed state at a common endpoint, including active and unresolved records. That gives you a defensible description of the group without turning missing outcomes into sales.
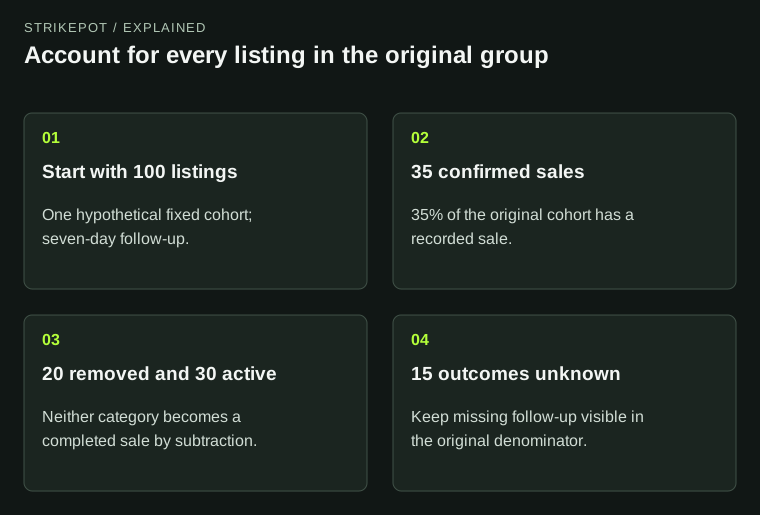
The outcome reconciliation makes the denominator explicit and prevents disappearing listings from being counted as sales.
Define a cohort before looking at the result
A cohort is a specified set followed over time. For this task it might be all listings meeting an exact item rule that you recorded during a particular hour. State the selection rule, entry time and follow-up period. Keep stable listing references so a replacement with a similar name does not quietly become the original.
A personally curated watchlist is also a cohort, but its selection matters. If you add only attractive prices or distinctive crafts, the results describe those choices. They are not automatically representative of every listing on the marketplace.
CSFloat's May 2021 watchlist announcement distinguishes listed, sold and delisted history. The existing watchlist guide explains those individual states. A cohort analysis uses such states to account for the entire starting population.
Keep all four outcomes in the table
Suppose you record 100 hypothetical listings and check them through a seven-day study. At the endpoint, 35 have a confirmed recorded sold outcome, 20 have a documented removal without a recorded sale, 30 remain active and 15 have an unresolved outcome. These are invented records, not measured marketplace performance.
| Observed outcome | Listings | Share of original cohort |
|---|---|---|
| Confirmed recorded sale | 35 | 35% |
| Documented removal without recorded sale | 20 | 20% |
| Still active at endpoint | 30 | 30% |
| Outcome unresolved | 15 | 15% |
| Original cohort | 100 | 100% |
You can state that 35% of the original cohort has a confirmed recorded sale by the endpoint. You cannot call all 70 non-active listings sold. Nor should you remove the 45 active or unresolved records and advertise 35 ÷ 55, about 63.6%, as the sale share of the original group.
That latter calculation may describe a deliberately defined subset, but it changes the denominator. It makes unfinished and missing observations disappear from the headline even though they are part of the question being studied.
Disappearance does not identify the outcome
A direct lookup can establish that a listing is gone while leaving its reason unknown. For a concrete documented example, CS Deals' single-listing endpoint returns the same not-found condition after a sale or a delisting. That response alone does not distinguish the two.
Use a specific sold record or other appropriate state evidence before counting a sale. An old asking price also does not become the achieved price merely because the listing later disappears. Negotiation, edits or a different outcome may remain unobserved.
Keep the uncertainty in its own column. If better evidence later resolves a record, update that record with the evidence date. Do not rewrite the original observation as though the outcome had been known at the time.
Unsold at the endpoint is not never sold
A listing that remains active after seven days has been observed without a sale for those seven days. Its eventual outcome is still unknown. It could sell later, change price or be removed. Calling it a permanent failure would overstate the available evidence.
This resembles the observation-limit problem called right censoring in statistics. NIST's discussion explains the concept using reliability studies. Applying the idea here means retaining how long a listing was observed without the event, rather than inventing a later sale time.
This analogy does not make an informal watchlist a valid survival model. Delisting and missing follow-up can relate to price, seller choices and item characteristics. Any model estimating eventual sale probability would need additional assumptions that this accounting exercise has not established.
Completed-sale times describe the completed subset
Imagine three sales finish after one, two and three days. Their average observed duration is two days. If 97 other listings remain unfinished, it is misleading to claim that the average listing sells within two days.
The calculation describes only the three completed sales. The unresolved durations of the rest have been omitted. That selection can make a market appear faster when the observation period is short or when difficult-to-sell listings remain active.
When presenting time information, state both the number of completed outcomes and the unfinished population. If you checked intermittently, the exact sale time may itself be unknown: you may only know that it occurred between two checks. Do not replace that interval with the later retrieval time without saying so.
Late entrants create another denominator problem. A listing added on the final study day has had less follow-up than one recorded at the start. Either define a common entry cohort or preserve each listing’s observation duration. A shared reporting date alone does not give every candidate an equal opportunity to produce an observed sale.
Report what the study can support
A reproducible note includes the entry rule, cohort size, start and end times, follow-up coverage, outcome counts and any changed prices. State whether a relisted item stays linked to its original identity or enters a separate listing cohort.
Use the comparable-sales guide when evaluating the price evidence of confirmed outcomes. Cohort tracking answers a different question: what happened to all the candidates, including those that did not supply a sale price. Keeping that denominator visible is what turns a success collection into an honest observation.