
Two daily skin-price charts can disagree while using the same transactions. If one groups sales by UTC midnight and another uses a different day boundary, the sales near midnight land in different buckets. The labels look comparable, but each day contains a different set of observations.
Before investigating a price discrepancy, recover the time zone and the rule used to assign a transaction to a day. A date is not a complete time definition.
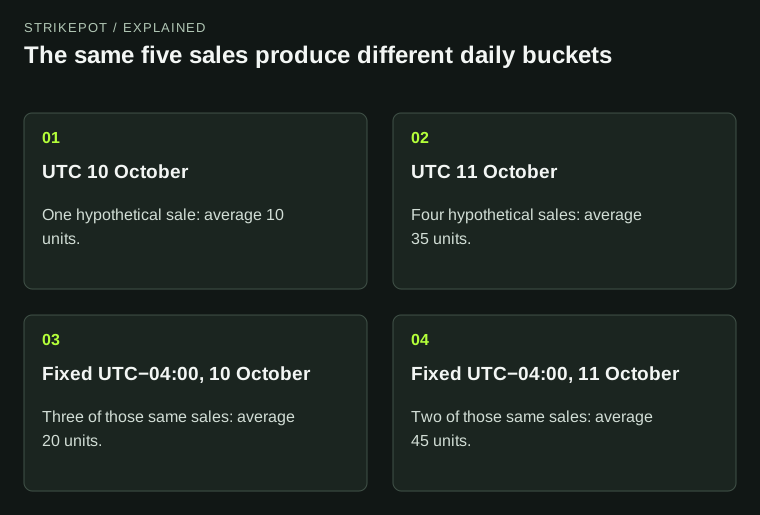
All five observations total 150 under either grouping. The fixed offset is illustrative and is not a named city’s seasonal rule.
Rebucket the same five transactions
The table below is an entirely hypothetical set of five one-copy completed sales in a single currency. It compares UTC with a deliberately fixed offset of UTC−04:00. That fixed offset is used only for this example; it is not a claim about a named city's seasonal clock.
| UTC transaction time | Price | Time at UTC−04:00 |
|---|---|---|
| 10 October, 23:30 | 10 | 10 October, 19:30 |
| 11 October, 00:30 | 20 | 10 October, 20:30 |
| 11 October, 02:30 | 30 | 10 October, 22:30 |
| 11 October, 05:00 | 40 | 11 October, 01:00 |
| 11 October, 23:30 | 50 | 11 October, 19:30 |
Using UTC dates, 10 October contains one sale at 10. The 11 October bucket contains four sales averaging 35. Using the fixed-offset dates, 10 October contains three sales averaging 20, and 11 October contains two sales averaging 45.
Both daily charts can be calculated correctly. Across the whole five-observation dataset, each uses the same total of 150 and the same overall average of 30. The difference comes from grouping, not missing money or a different transaction price.
Check the exact interval at midnight
A clean daily rule might include the start of the day and exclude the start of the next day. Under that rule, a transaction exactly at midnight belongs to the new day once. If both neighboring intervals include their endpoints, the midnight observation can be counted twice.
State the boundary convention for your own analysis. When reading a supplier's summary, use its documented definition or mark it unconfirmed. Do not assume the display's local formatting establishes the server's aggregation rule.
The same issue applies to weekly periods. A rolling seven-day window, a Monday-start calendar week and a Sunday-start calendar week can contain different transactions. The statistics guide helps identify the period label; a daily comparison also needs its clock boundary.
Keep event time apart from observation time
A sale can occur before your spreadsheet learns about it. Saving the retrieval time as the sale time moves the transaction to a later bucket, especially when you import a batch after midnight. The next day can then look unusually busy for a reason created by collection.
CS Deals' sales-history schema includes a sold-at field for the transaction row. Where an appropriate event time is available, preserve it rather than replacing it with the time you downloaded the file.
Keep the retrieval time too. It answers when you obtained the evidence and helps diagnose delays. An event timestamp and a retrieval timestamp serve different purposes; a useful log can retain both without treating one as a substitute for the other.
Generation and update timestamps need their own labels
A cached response may have been generated earlier than the time you requested it. CS Deals documents a generated-at timestamp for its full price snapshot. That field describes the snapshot generation, rather than proving a new transaction happened at that time.
Skinport's Items documentation uses Unix timestamps for its creation and update fields. Other schemas use formatted timestamps. Preserve the documented representation and meaning instead of dropping every field into one unlabeled “date” column.
If a field's meaning is unclear, do not infer that it is the last sale time from its name alone. A price record can be updated because its source or available listings changed. The evidence must support the specific event you claim.
Seasonal clocks can make local days unequal
A fixed offset is easy to calculate, but a named local time zone may change offset during the year. Around a seasonal clock change, a local calendar day can differ in length from an ordinary 24-hour period. That matters when comparing counts per day or assigning ambiguous local times.
For reproducibility, keep a timestamp with its UTC offset or another unambiguous original time reference. If you want calendar-day reporting for a named zone, retain that zone as part of the aggregation rule. Do not silently replace it with one permanent offset.
An unlabeled local time such as 01:30 may be insufficient to identify a unique instant near a backward clock change. If the source does not provide enough information to resolve it, keep that limitation visible rather than placing the row by guesswork.
A partially observed day needs its own qualifier. Comparing today's first few hours with yesterday's complete calendar day changes exposure as well as prices. State the actual covered interval before interpreting a lower count as quieter trading.
Reconcile before comparing the price story
When two charts differ, first match item identity, currency, price type and inclusion rules. Then compare event timestamps and day boundaries. Reaggregate a shared set of rows under the same rule where you have enough detail.
The supplied-history plotter can display your saved data, but the chart cannot recover an omitted time zone or an event time that was replaced during import. Fix those inputs before treating the difference between lines as a market event.
A useful comparison note names the day boundary, timestamp basis and observation period. Once those match, any remaining disagreement becomes more specific: different records, different summaries or different coverage. Midnight stops being a mystery when it becomes an explicit part of the measurement.